jeff@lingtechsolar.com
Tel:+86 755 23200509
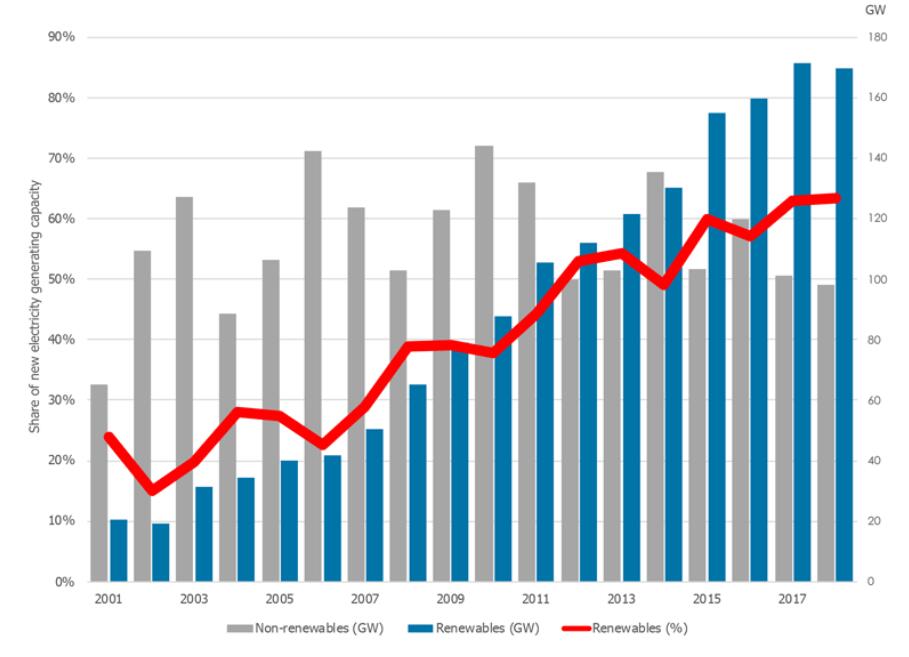
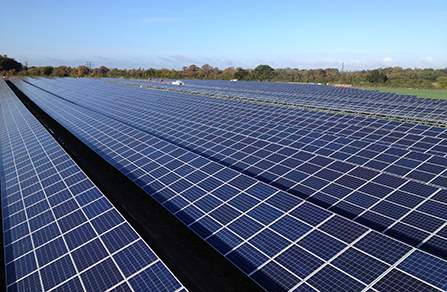
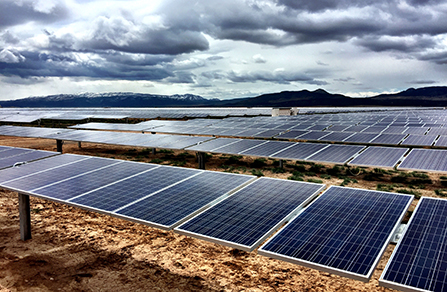
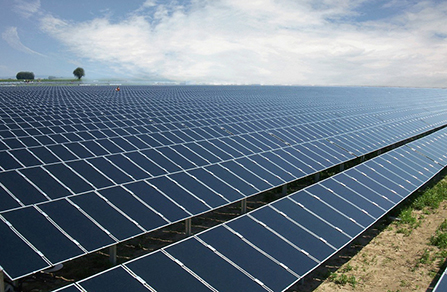
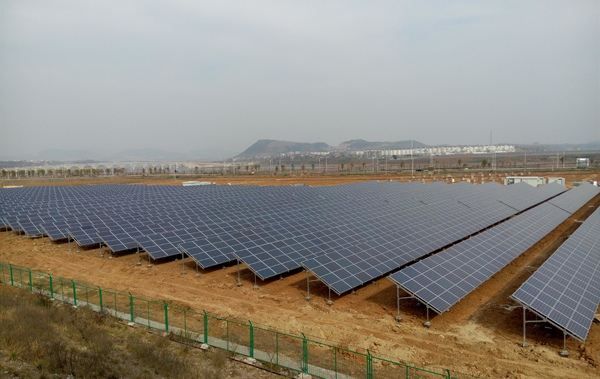
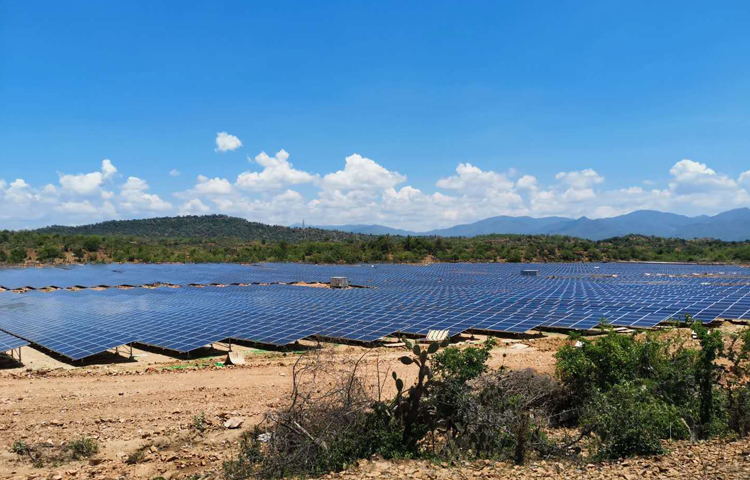
Asia leads the way! In 2018, the global photovoltaic installed capacity increased by 94GW.
According to the latest data of the International Renewable Energy Agency (IRENA), in 2018, the global new grid-connected photovoltaic installations were 94.3GW, and in 2018, the global new renewable energy installations were 171GW. The new solar installations accounted for more than half of the renewable energy installations, and the cumulative installed photovoltaic capacity accounted for about 1/3 of the global renewable energy.
Photovoltaic power generation gradually increased from 135GW in 2013 to 386GW in 2017, and then jumped to 480GW in 2018, realizing a 3.5-fold growth in just five years. Among them, Asia, the United States and a few European countries and South America, the Middle East and other emerging countries have become the main support for last year’s new photovoltaic installed bright data.
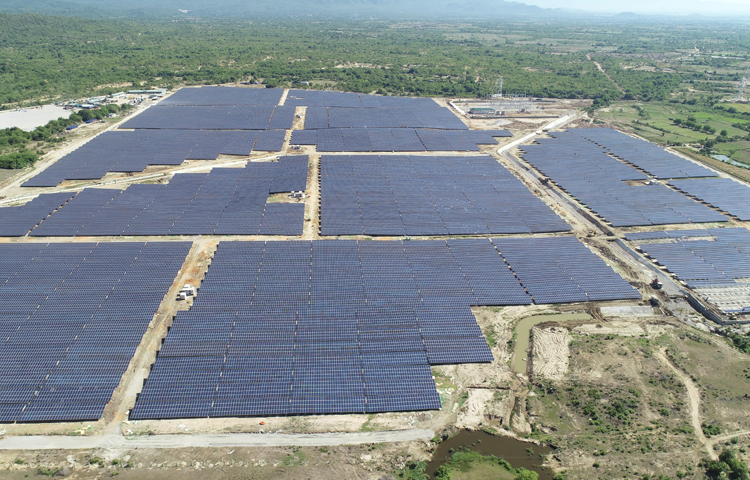
Asia is undoubtedly the king of installation, leading with 64GW of new grid-connected pv installations, which increased from 210GW in 2017 to 274.6GW in 2018, becoming a clear driving force for the development of the global PV industry. IRENA data shows that China’s pv installations grew from 130GW to 175GW, Japan from 29GW to 55.5GW, India from 17GW to 26.8GW, South Korea from 5.8GW to 7.8GW, Pakistan from 742MW to 1.5GW, The cumulative pv installation capacity of the five countries has reached 265.3GW, accounting for about 97% of the total pv installation capacity in Asia, helping make Asia the strongest growing region among several continents. In 2017, the accumulative installation capacity of the above five countries accounted for about 87% of the whole Asia, and increased to 97% in 2018, showing the regional concentration trend of photovoltaic development.
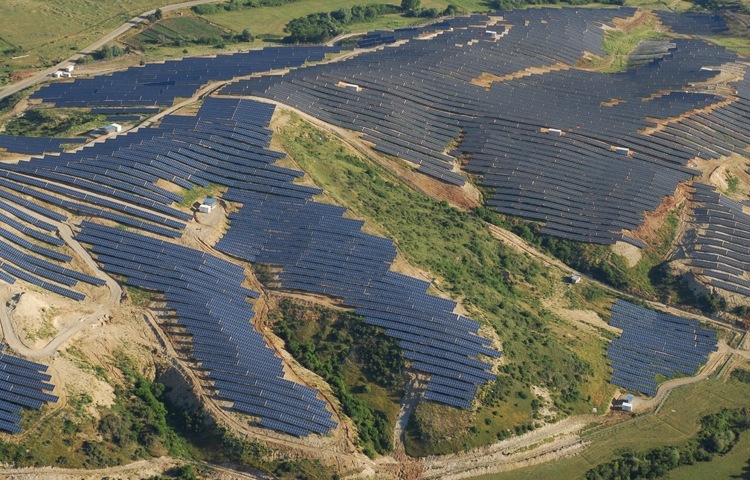
Pv installed capacity in the United States increased from 42GW at the end of 2017 to 49GW at the end of 2018, Europe grew from 110GW to 119.3GW, and Australia grew from 5.9GW to 9.76GW. The three major European and American markets added 20GW in 2018, with a steady growth rate of 12.6%. Accounting for about 21.3% of the global photovoltaic installed capacity in 2018. It is worth noting that the European photovoltaic development relatively active countries basically constitute the entire European photovoltaic development map. For example, in Germany, the newly installed pv capacity increased from 42.3GW to 45.9GW, breaking the 3GW mark again since 2013. The cumulative installed capacity of THE UK was 13.4GW, Belgium 4GW, The Pv installed capacity of the Netherlands increased from 2.9GW to 4.1GW, France from 8.6GW to 9.4GW, Italy from 19GW to 20.1GW, and Spain from 4.72GW to 4.74GW.
Elsewhere, the US (42GW to 49GW), Europe (110GW to 119GW) and Australia (5.9GW to 9.76GW) also recorded solid pv construction last year. European hot spots include Germany (42.3GW to 45.9GW) and the Netherlands (2.9GW to 4.1GW), while France (8.6GW to 9.4GW), Italy (19GW to 20GW) and Spain (4.72GW to 4.74GW) are increasing prices during 2018.
In contrast, South America, Africa, Eurasia and the Middle East are lagging behind in terms of new growth, but show very aggressive growth potential. In 2018, pv installations increased from 3.4GW to 5.4GW in South America, from 3.7GW to 5.1GW in Africa, from 3.6GW to 5.6GW in Eurasia, and from 2.07GW to 3.02GW in the Middle East, with a cumulative increase of 6.35GW and a growth rate of about 50%. Among them, Mexico grew from 674MW to 2.5GW and Brazil grew from 1.09GW to 2.29GW, which IRENA identified as bright spots in 2018.
In addition to the rapid development of grid-connected photovoltaic projects, off-grid photovoltaic projects are also growing rapidly worldwide. According to IRENA, off-grid PV projects grew from 1.5GW in 2015, 1.98GW in 2016, 2.5GW in 2017, and 2.9GW in 2018.
Broken down by continent and region, Asia again led the way, rising from 1.36GW to 1.6GW. Africa (853MW to 938MW) ranked second, followed by the Middle East (156MW to 206MW), Central America and the Caribbean (88MW to 88.9MW) and South America (73MW to 81MW).
 Download Brochure